Topic: Do public high schools with higher percentages of minority students also have larger teacher ratios? How is this question reflected across different locales in four different states?
The National Center for Education Statistics (NCES), a body of the Institute of Education Sciences (IES) within the U.S. Department of Education (ED), seeks to improve student outcomes by collecting, analyzing, and reporting data on the condition of U.S. education from early childhood to adult education. A program within the NCES, the Education Demographic and Geographic Estimates (EDGE), designs and develops data resources to help understand the social and spatial context of education in the United States. Using data from the U.S. Census Bureau’s American Community Survey (ACS), EDGE creates custom indicators of social, economic, and housing conditions for school-age children and their parents. It also uses NCES and Census Bureau data to create geographic locale classifications, school geocodes, school district boundaries, catalog student populations, and other types of data to support spatial analysis and policy making.
Our group was curious what biases or inconsistencies would be revealed upon an examination of the EDGE dataset. Specifically, we were curious as to the potential correlation between higher percentages of minority students and high students-teacher ratios in public high schools. The EDGE datapool consists of 101,391 inputs, each a single school in the U.S. Considering this, we decided to restrict our area of study to the four states our group members are from (OR, CA, MN, and MA), and six high schools per state. To bolster the diversity (and efficacy) of our findings, we selected schools across various social, economic, and geographic backgrounds: school districts across different counties, school locations in different urban environments (Rural, Town, Suburb, City; Fringe, Remote, Distant, Small, Mid-Size, Large), various total student populations and ethnic distributions, and different student-teacher ratios.
We initially expected a correlation between higher student teacher ratios and higher minority student body populations as a reflection of policies such as redlining or gerrymandering. Additionally, we anticipated that student teacher ratios would be lower in urban locales (Suburbs, Cities) than they would be in rural ones (Rural, Towns), implying economic and political representation disparities across different areas. To accommodate as many areas as possible and organize our data, we tried to diversify our school selection efficiently. We selected five rural schools and three town schools because we imagined that they’d offer greater consistency in appearance and function. Cities were the area we anticipated to have the most general variety, so we included nine of them. Lastly, we selected six suburbs. For further accuracy, we diversified different locales into sub categories based on size and/or location (e.g., rural = remote, distant or fringe, city = small, mid-size, large.
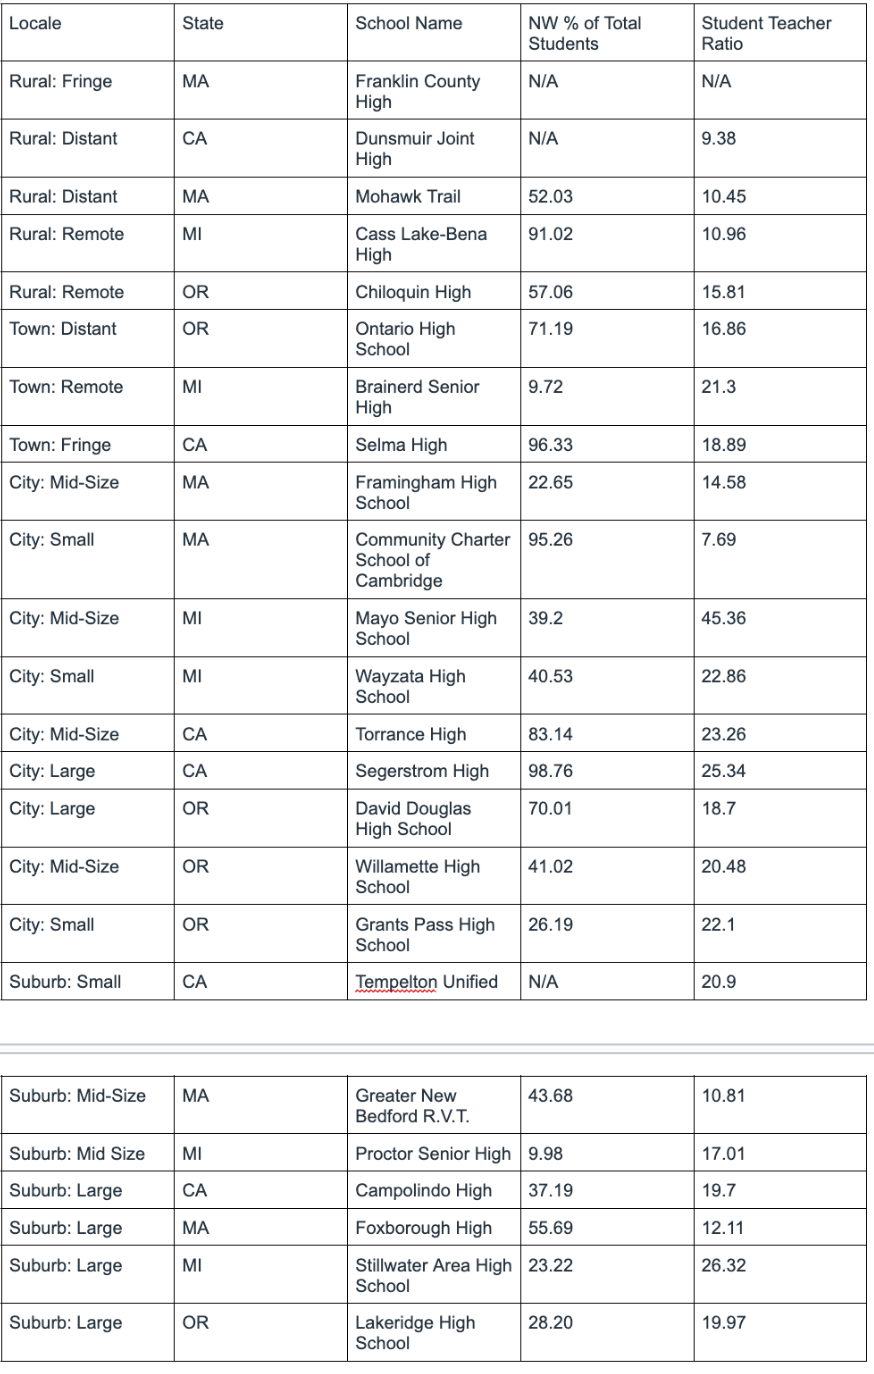
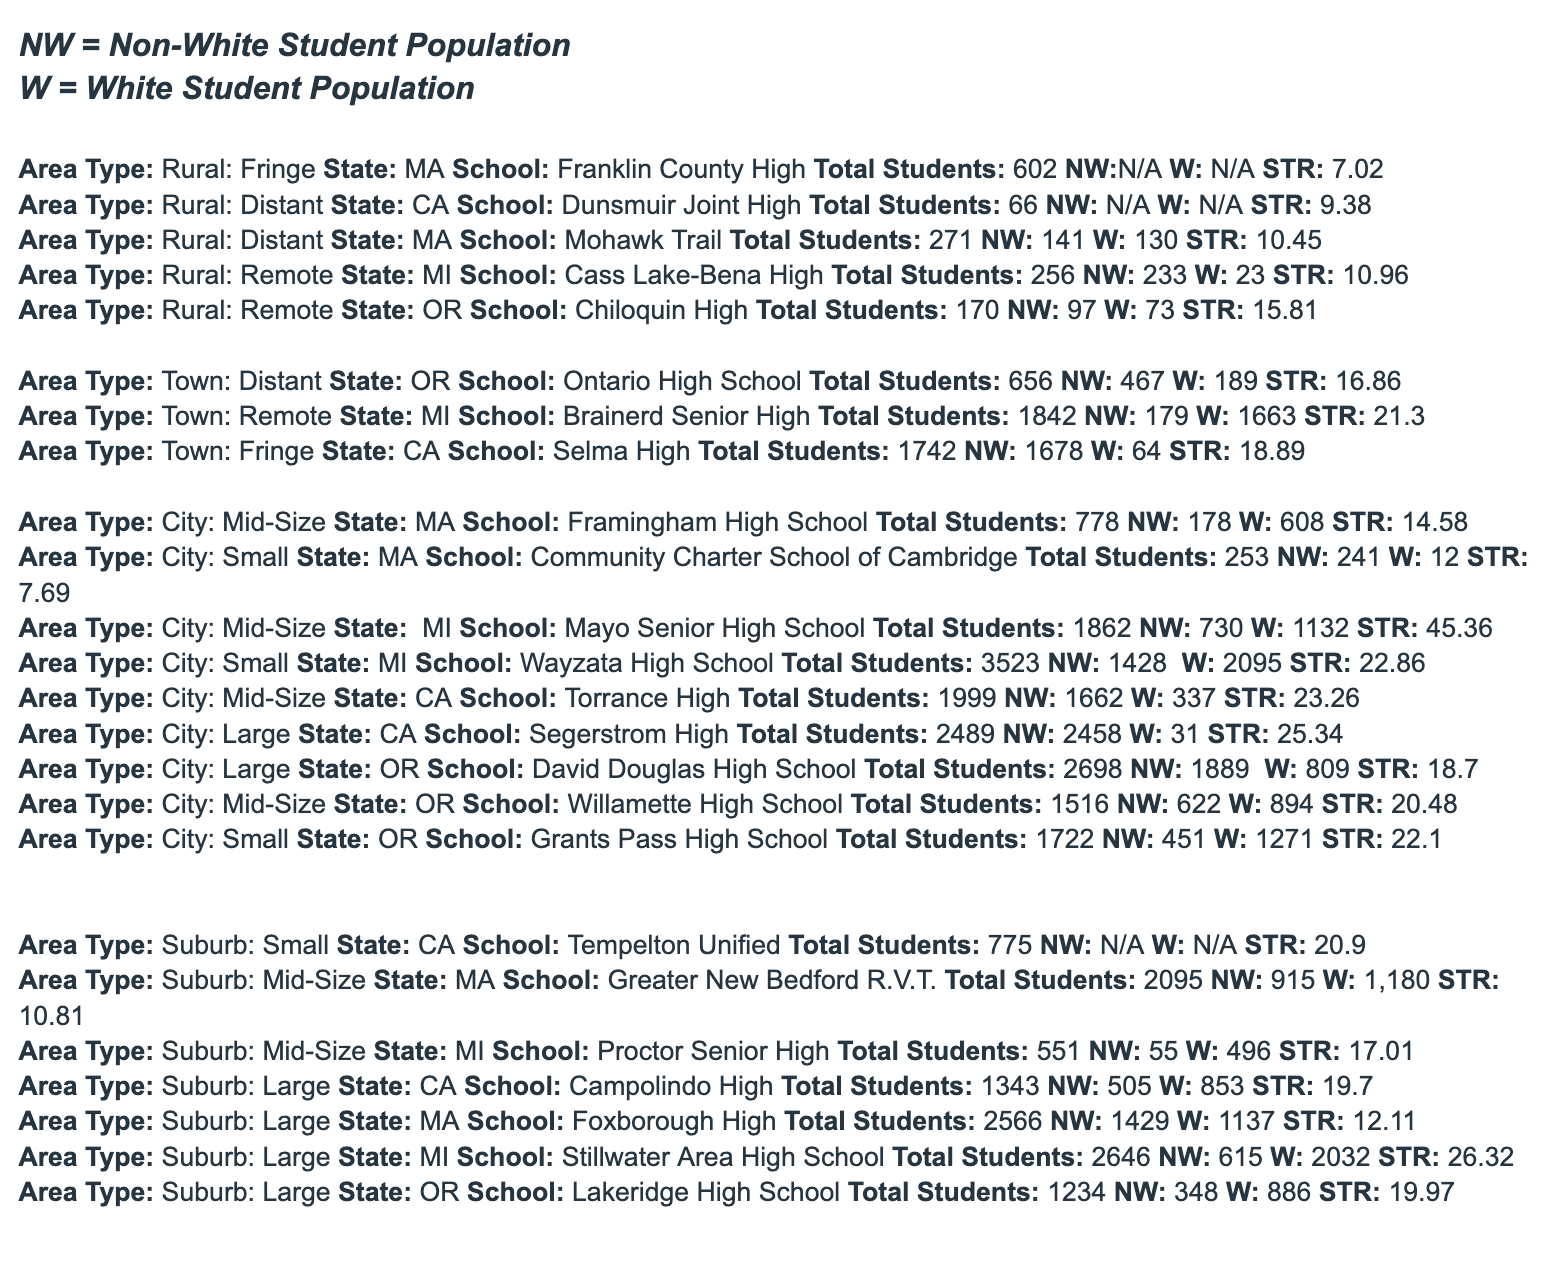
EDGE's wide range of functions data definitions that are used in a variety of tasks, meaning that its is a multifunctional dataset that exists to accomplish numerous different objectives. In light of this, our group noticed an extreme range of information: grade level, area codes, state geography, school type, grading systems, school lunch programs, in-depth ethic and gender demographics, and student and teacher populations. With such an extensive amount of information being implied by each of these definitions and considering their nuances, our group decided to use multiple methods of analysis: denotative and connotative. We did this because answering our question required a factual and literal understanding of the data, but also an acknowledgement of nuance. We noticed inconsistencies in the datapool -- many rows were entirely empty. One of our members reported entire school districts from their home town being missing. Considering that school district student populations can number in the thousands, this is an absence of crucial information on the very same people it generates policy for. Further examination found nearly all of the columns had missing information. This was problematic for us because as we tried to find schools that would diversify our datapool, there were many instances of missing data on vital information we needed to answer our question. We then averaged the percentage of non-white students to white students per school and compared these averages to student teacher ratios across different states and locale types to see if any patterns emerged. This way, we were able to assess our question across multiple areas of society, allowing us to answer our question more effectively. We then selected 5 columns most relevant to our discussion to refine our data further: Locale, state, school name, % of non-white students, and student teacher ratios. (Data is attached in images).
Findings: Across all 24 schools, there wasn't a consistent correlation between higher percentages of non-white students in student populations and higher student teacher ratios (e.g., Segerstrom and Torrance being in support of the question, Community Charter in opposition). However, we make two alternate discoveries: student teacher ratios correlating with locale (unrelated to sub category) and student teacher ratios very different across the 4 states. Average student teacher ratios in rural areas (11.65) are lower than towns (19.02) by an average of about 7 students per teacher, and towns (22.21) are lower than cities by about 3. Suburban areas have an average of 18.13 students per teacher. This supports our initial expectations. As far as states, the CA average was 19.59, MI average was 23.97, MA average was 11.13, and the OR average was 18.99. From these findings, we came to a couple rough conclusions: our chosen data pool wasn’t large enough to accommodate the broadness of our question, and the EDGE dataset as a whole lacks the definition we needed to acutely address our goals. The EDGE dataset, and thus our own, provides little insight as to why the student teacher ratios are so different across the four states, but so similar when it comes to locale. Intuition and external resources aside, we weren't very well equipped to answer our question. To succeed, we would've needed to research budget and policy constraints, education guidelines and population and socioeconomic distribution on a state by state, even county by county basis. The EDGE dataset doesn't provide these things. As reflected by our data, the answer to our question is technically No. That being said, it can't be certain that our selected data or the dataset itself can accurately answer our question because our pool is about a 1/4000th of the available information, and the information itself is inadequate.
An examination of whether public high schools with more minority students have larger student-teacher ratios by analyzing data across different locales in Oregon, California, Minnesota, and Massachusetts to uncover potential conclusions and/or data inconsistencies.