
Background
This project focuses on Diabetes within 130 US Hospitals [Dataset: Diabetes 130-US Hospitals for Years 1999-2008].
Through the analysis of this dataset, our group will observe through the lens of equality and bias to determine if the structure of this database affirms bias from the provider towards their patients and/or fails to provide preventative and therapeutic interventions, leading to a correlation with their readmission into the hospital after 30 days. Specifically this project will be focusing within the scopes of gender, race, financial status, industry standards, and local/state/federal regulations using the Macro-Level and Denotative methodologies of Professor Dr. Colin Koopman and Lindsay Poirier respectively.
Problem Statement
Socioeconomic healthcare inequality has long been a pressing issue in the healthcare industry. Recently, it has become a more widespread social issue since President Obama's presidency (2009-2017) and the introduction of the Affordable Care Act (ACA), giving low-income Americans access to healthcare. The question at hand is what variables are potentially missing from, poorly defined, or included in the dataset to determine who gets the proper intervention and preventative care that they need? Within the scope and lens of our analysis, we'll be illustrating that the variables present, absent, and poorly defined within the data reflect and reinforce systemic socioeconomic inequality and structurally fails to provide adequate preventative care and intervention.
Denotative Analysis
Variables Included: gender, race, age, weight, admission type (i.e. newborn, emergency, elective, etc.), discharge type (i.e. expired, discharged to home, etc.), payer_code (insurance type), medical specialty (of the doctor assigned to them), the number of labs and other types of procedures done, up to 3 diagnoses, drugs prescribed/changes in those dosages, readmission count, and their time in hospital (days).
Variables Not Included/Defined: family background (i.e. any relevant family medical history), income, disorders (specifically any eating-related ones), alcohol use, smoke/substance usage, exercise habits, diets/meals, vital signs, imaging results like X-Rays, Biopsy’s, and Quality of Life, and body weight/BMI.
Notes:
- As Lindsay Poirier states, definitions matter. In this dataset, many of the variables are not clearly defined. A specific example of this is gender. It leads to the question of how was it collected and defined? Was it self-reported? Was it based off visuals? Was it based off of at-birth sex? This general lack of explanation/collection philosophy extends to the entire dataset.
- Identifying markers such as `gender`, `race`, `age`, and `weight` could've been used for statistical analysis, such as finding correlations between age and readmissions. However, it carries the risk of being used in discriminatory or biased ways (e.g. racism, ageism, and transphobia) if a patient identifies differently than what was recorded. Without clear definitions of how these variables were collected, they are open to biased interpretation, which is an equality concern directly tied to Poirier's argument that undefined or poorly defined variables and data leaves boundaries unpoliced.
- Additionally, there is an extreme disparity between different demographics, as shown below.
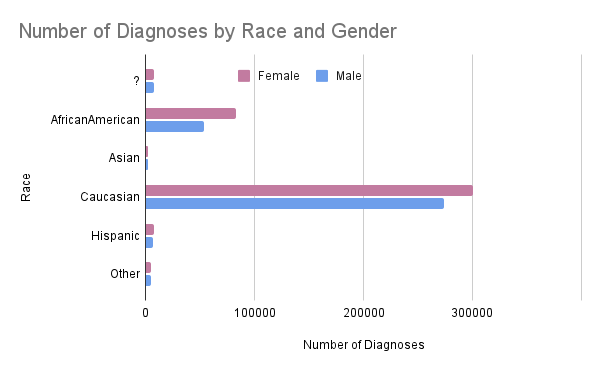
- Additionally, there is an extreme disparity between different demographics, as shown below.
- Weight can be a huge factor in helping a medical staff determine a plan to combat and treat the patient, but the `weight` column has `?` values, making it effectively useless as a clinical variable. The values being omitted without a reason, whether it be for HIPAA compliance or if that specific field was not prioritized, leads to a definition/clarity error.
- A lack of crucial information such as lifestyle attributes (e.g. alcohol use, smoking frequency, exercise habits, family history, quality of life, and diet) in the dataset could be dangerous as the medical provider may not have enough information to come up with the best diagnoses for a patient and their treatment plan, potentially causing the patient to be readmitted into the hospital within the 30 day window.
- The `payer_code` attribute of the dataset could be a red flag to the provider and be used against the patient. A patient might not receive the necessary treatments and medicines because of their financial situation, which could lead them to be in a cycle of debt if they are constantly being readmitted for the same issue/symptoms and having to pay for more basic or mediocre treatments. It could also be used to assist in determining what the patient is able to afford so the doctors are able to give them the best treatment for the price that they are able to pay at. Examples may include but are not limited to:
- `Medicaid`: A provider might see that a patient has medicaid and assume that the patient is lower-class and is unable to afford more expensive treatments. This predisposition could cause a health provider to fail to provide the patient with all of their options.
- `Private Insurance`: A provider might see that a patient has private insurance and assume that the patient is middle to upper-class and similarly this disposition could affect how the provider approaches the patient. Typically patients who are able to afford treatment will get a volume of amazing options, and can result in a decrease in readmission into the hospital within the 30 day time period.
- `Self-Pay`: A provider might see that a patient has no insurance and assume that the patient does not have the money for treatments. However, this attribute can also mean that the patient is able to pay out-of-pocket either through savings or through medical-based loans. Between those two possible scenarios, the provider would have no idea which situation the patient is in, but a reality is that some hospitals can likely lean towards believing that the patient is in a low financial standing. This can lead to discrimination and the provider asserting on the patient a lack of viable and preventative options for the diabetic patient.
- In general, this dataset does not fully capture patients' socioeconomic statuses, and it could be dangerous to let providers assume this information based on limited data. However, even if these data are defined or not, it could still lead to discrimination and bias. A viable solution possibly is requiring by federal law, to give the patient all of their available options, regardless of socioeconomic status.
Taken together, the vague, undefined, and missing variables in this dataset make it structurally incapable of identifying socioeconomic inequality in patient care delivery. When definitions are absent or imprecise, as Lindsay Poirier warns, the boundaries of the data fail to specifically define what some attributes mean, resulting in it being left up for interpretation. It also doesn’t capture the full reality of the situations of the patients it represents. The patients most harmed by this failure are already those at a huge disadvantage socially and financially.
Macro-Level Analysis
Analysis: `payer_code` is included mostly for administrative and billing aspects of the medical institution rather than giving the medical provider a holistic picture of the patient’s health and socioeconomic status. Variables such as quality of life and family history require additional effort to standardize and store, and this reflects the structural bias Koopman points to in his Format Anatomies. This reflects the priorities of the institution, which is that the financial and administrative side is more prioritized, instead of the comprehensive and equal care of the patients they serve.
Analysis: The dataset was created during 1999, and back then, there were no strict federal regulations for how patient health databases should’ve been formatted as regulations were in a transitionary phase, moving from generic and broad state laws to federal/national standards. Aside from following the HIPAA Privacy Rules enacted by Bill Clinton in 1996, this dataset did not follow strict regulations. In the current landscape, standards such as the USCDI v6 or the draft of USCDI v7 now mandate a much more specific set of patient data, insurance details, as well as quality standards. This dataset does not meet completely all of these standards and only has a barebones skeleton format of what should be on a standard U.S. patient health dataset. While hospitals are heavily encouraged to follow the USCDI v6 standards, as of January 2026, they must at minimum follow the USCDI v3 standards.
Question: Did the database do a good job of accounting for financial status differences?
Analysis: Medical claims databases collect a ton of data, some of which include, but are not limited to:
- Medical Tests and Examinations
- Treatments and Medications
- Insurance Coverage
- Treatment Costs
- Filed Claims
They collect this data from hospitals, as well as by themselves. However, much of this specific data is missing from the database. This indicates that the database was not built in the best interest of the patients, and neither for analyzing potential financial barriers, while also being reliable for the patient and their needs.
Analysis: The dataset did not define how this variable was gathered or what it specifically refers to.
According to the dataset, 53.76% of the patients were identified as female, while 46.24% were identified as male.
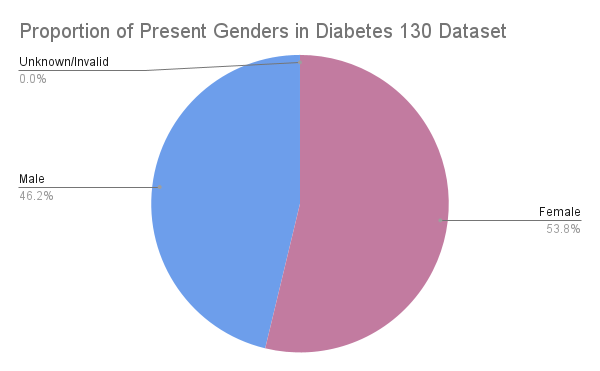
Only 3 patients in the entire dataset were marked as `Unknown/Invalid`, which is the only other value present outside of the binary. Because of this, we believe that the gender tab refers to assigned sex, as with only 3 non-binary patients present in a dataset of 101,000+ would be extremely unlikely considering that the US’s average hovers around 1%. It’s likely that the 3 `Unknown/Invalid` entries are intersex individuals or somehow corrupted data.
Link to Presentation: Google Slideshow
Link to Spreadsheet: Google Spreadsheet
Website Author: Kestrel True
This project focuses on the clinical care of diabetes patients within 130 US Hospitals [Diabetes 130-US Hospitals for Years 1999-2008] between 1999 and 2008. Through the analysis of this dataset, our group will observe through the lens of equality and bias to determine if the structure of this database affirms bias from the provider towards their patients and/or fails to provide preventative and therapeutic interventions, leading to a correlation with their readmission into the hospital after 30 days.